
Run your first flow
Copy page
In this tutorial, you start Sluice on your computer and write a flow with two tasks. You run the flow from the web UI and read its execution. Then you run the same flow from a terminal with the sluice CLI.
Before you start
Section titled “Before you start”You need these tools:
- Docker with the Compose plugin.
- git.
- A free host port 8080.
Start Sluice
Section titled “Start Sluice”The file deploy/compose/compose.yml in the Sluice repository starts two services. The postgres service is the database. The sluice service is the server and the web UI. Its image, sluice-uv:dev, runs Python, bash and bun tasks on the process executor.
-
Clone the repository and go into it:
Terminal window git clone https://github.com/alternayte/sluice.gitcd sluice/ -
Set the two variables that the compose file requires:
Terminal window export SLUICE_BOOTSTRAP_ADMIN_PASSWORD=change-me-now-1export SLUICE_MASTER_KEYS="k1:$(openssl rand -base64 32)"SLUICE_BOOTSTRAP_ADMIN_PASSWORDis the password of the first admin.SLUICE_MASTER_KEYSholds the key that encrypts secrets. Keep this value. Sluice needs the same key at each start to decrypt the secrets that it stores. -
Start Postgres and Sluice:
Terminal window docker compose -f deploy/compose/compose.yml up -dThe first start builds the image
sluice-uv:devfrom the repository. -
Check that Sluice is ready:
Terminal window curl -fsS http://localhost:8080/readyzThe response is
{"status":"ok", …}with one check each for the database, the master keys, the migrations and the storage.
The compose file also reads these optional variables:
| Variable | Default | Purpose |
|---|---|---|
SLUICE_BOOTSTRAP_ADMIN_EMAIL |
admin@local.test |
Email of the first admin. |
SLUICE_PORT |
8080 |
Host port of the UI and the API. |
SLUICE_PUBLIC_URL |
http://localhost:8080 |
External URL. Cookies and webhook URLs use it. |
POSTGRES_PASSWORD |
sluice |
Password of the database user sluice. |
Sluice creates the admin only when the database has no users. A later start with another password does not change the admin.
Sign in
Section titled “Sign in”- Open http://localhost:8080.
- Type
admin@local.testin Email. - Type the password from the last section in Password.
- Click Sign in.
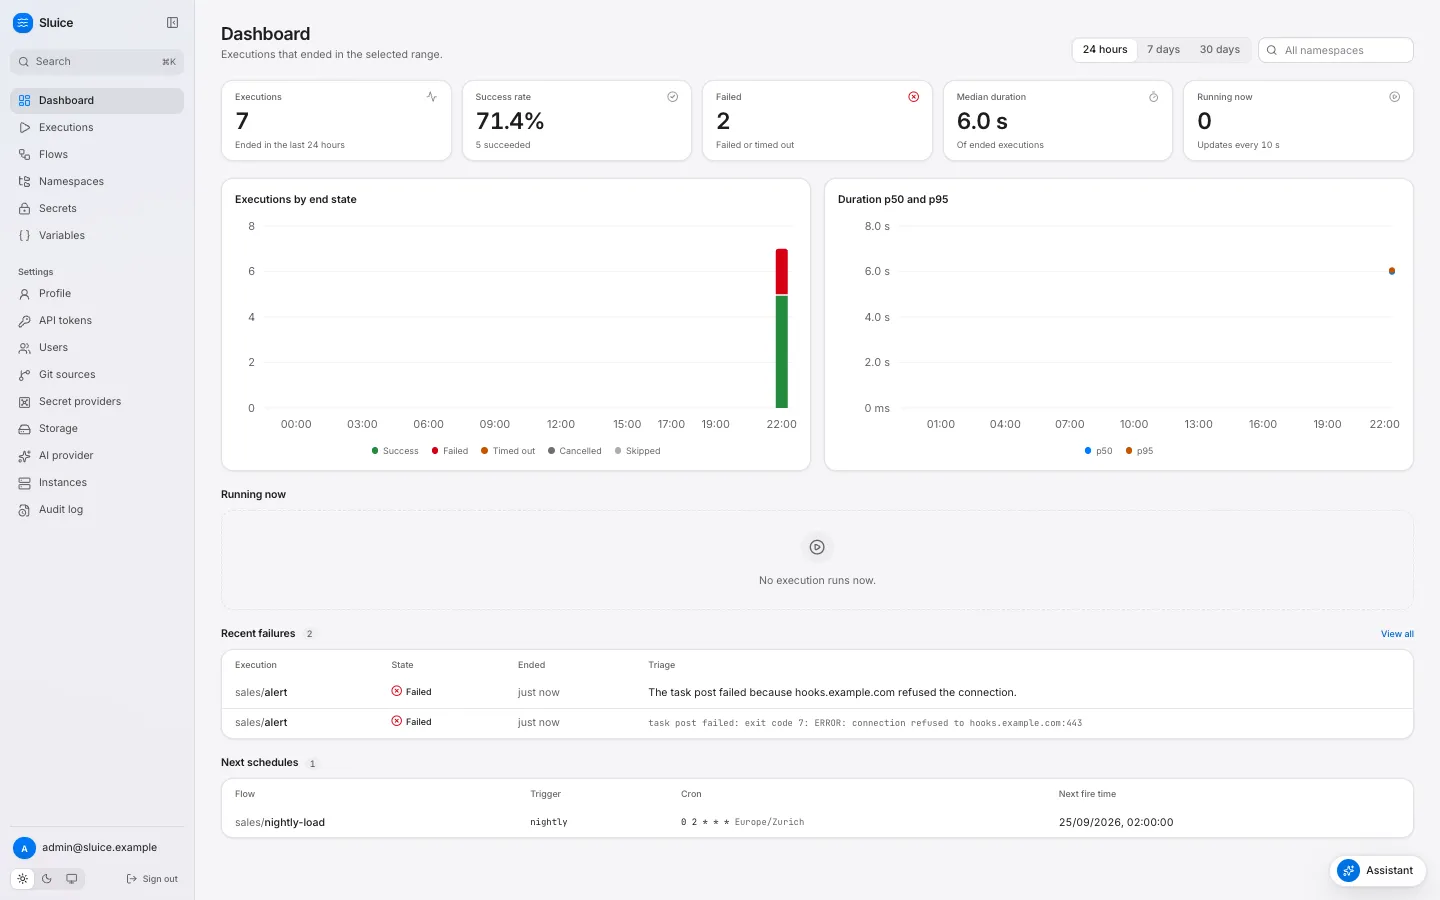
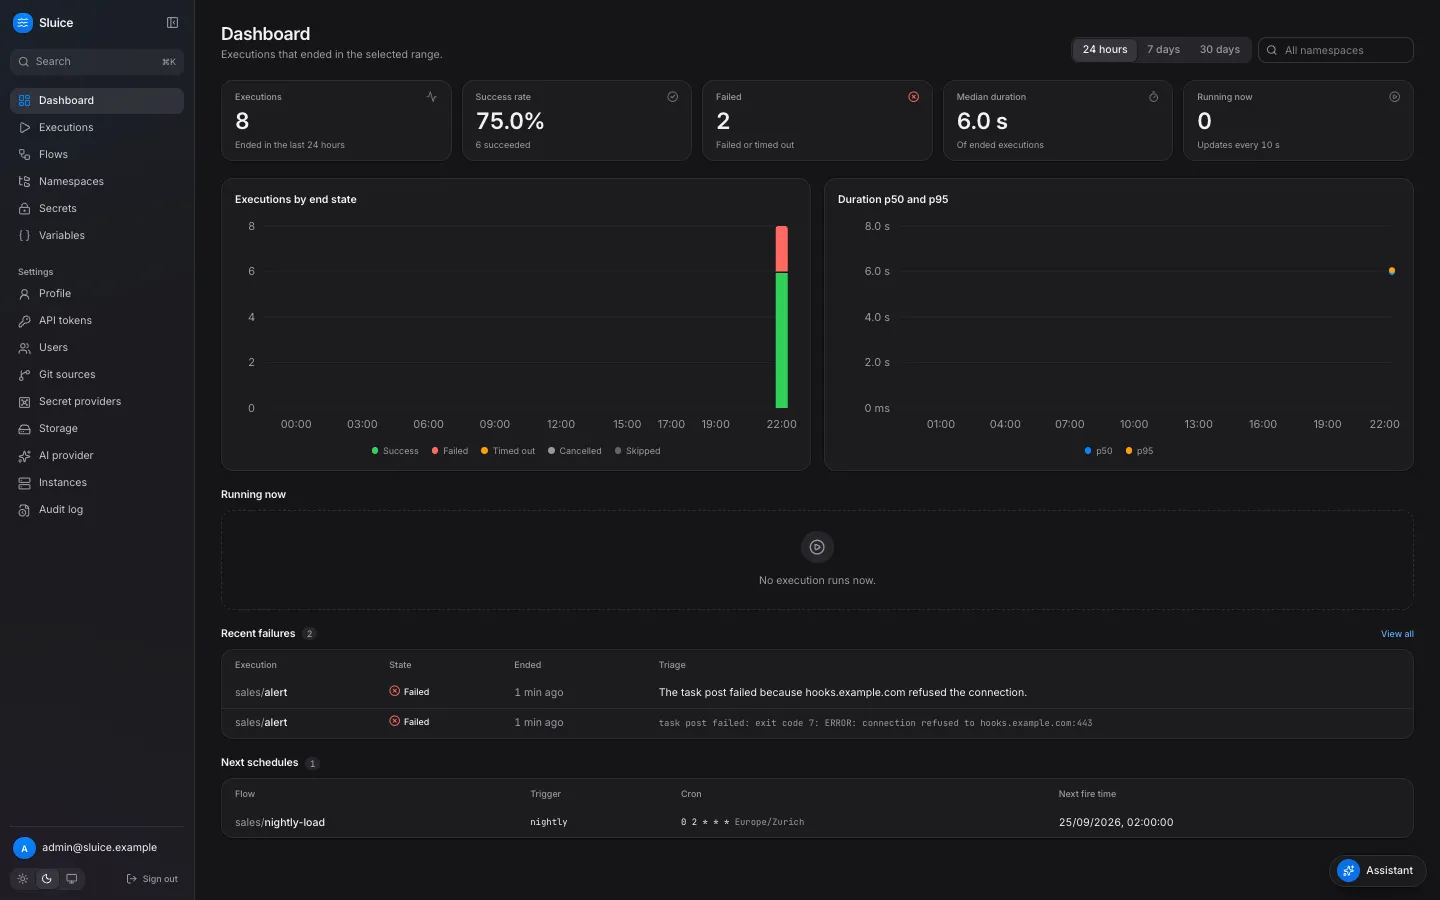
The dashboard opens. It shows the executions of the last 24 hours, the success rate, the running executions, the recent failures and the next schedules. All of them are empty for now.
Create a namespace
Section titled “Create a namespace”A namespace holds flow files and the scripts that they run. Each save of a namespace makes a new version.
- Click Namespaces in the sidebar.
- Click Create namespace.
- Type
demoin Name. - Click Create.
The list shows the namespace demo. A name has lower case letters, digits and hyphens. A dot makes a child namespace, for example demo.eu.
Add a flow
Section titled “Add a flow”- Click
demoin the list. The Files tab opens and shows “This namespace has no files.” - Click Create a file.
- Type
hello.flow.yamlin Path, then click Create. The editor opens the new file. - Paste the flow from the code block below this list into the editor.
- Click Save above the editor. The Save file dialog opens with the commit message
Create hello.flow.yaml. - Click Save.
This is the flow:
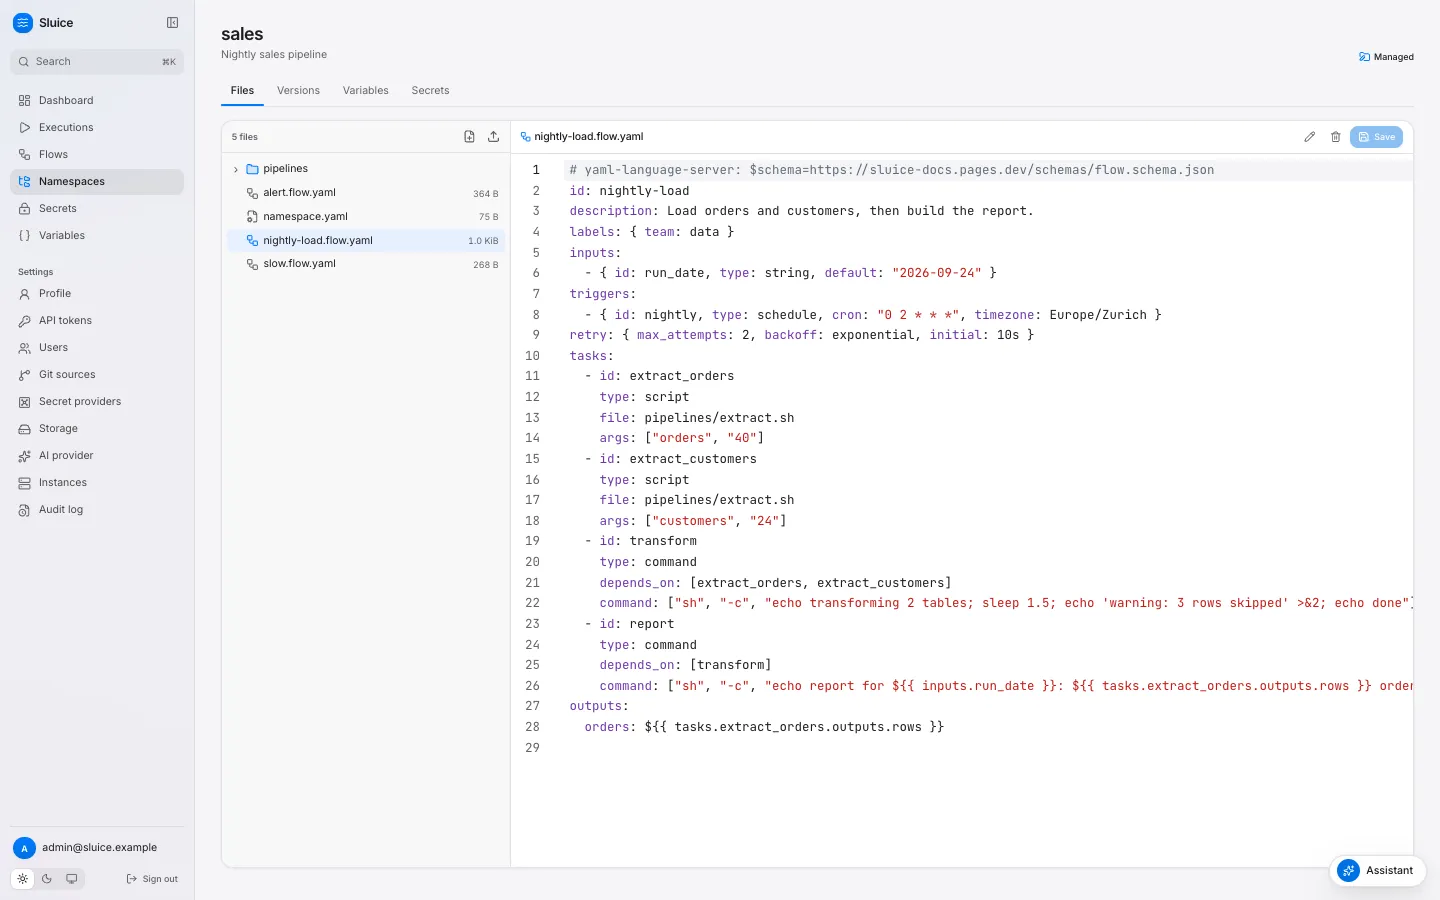
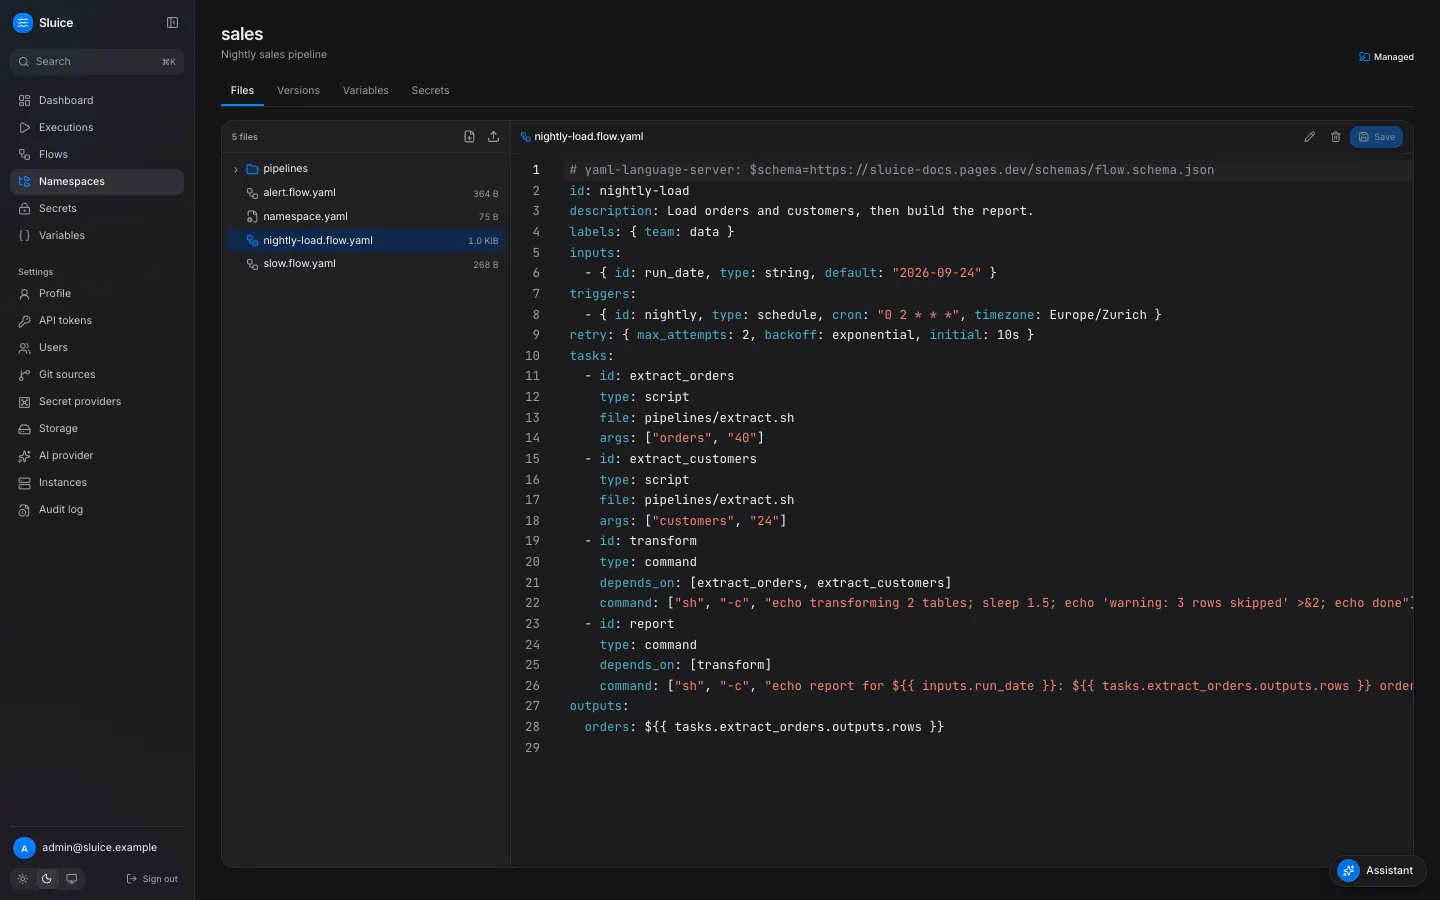
# yaml-language-server: $schema=https://sluice-docs.pages.dev/schemas/flow.schema.jsonid: hellodescription: Greet someone, then report the count.inputs: - { id: name, type: string, default: world }tasks: - id: greet type: command env: NAME: ${{ inputs.name }} command: - sh - -c - | echo "hello $NAME" echo '{"type":"output","key":"count","value":3}' >> "$SLUICE_OUTPUTS" echo '{"type":"metric","name":"greetings","value":3,"unit":"rows"}' >> "$SLUICE_OUTPUTS" - id: report type: command depends_on: [greet] command: ["echo", "greet counted ${{ tasks.greet.outputs.count }}"]outputs: count: ${{ tasks.greet.outputs.count }}The flow has one input, name, with the default world. The task greet prints a greeting. It also writes one output and one metric to the file in $SLUICE_OUTPUTS. The task report starts after greet and reads the output through the template ${{ tasks.greet.outputs.count }}.
The editor validates a flow file while you type. A mistake gets a marker on its line, and a list of validation errors shows below the editor. To see it, change depends_on: [greet] to depends_on: [greeting]. Then change it back.
Run the flow
Section titled “Run the flow”- Click Flows in the sidebar. The list shows
demo/hello. - Click
hello. The Overview tab of the flow opens. - Click Run. The dialog Run hello shows the field
namewith the valueworld. - Click Run in the dialog.
The execution page opens. You need the operator role or a higher role to run a flow. The admin has all roles.
Read the execution
Section titled “Read the execution”The execution page updates live while the tasks run. It has three parts:
- The header shows the flow, the state, the execution ID and the buttons Download JSON and Rerun.
- The details show Duration, Trigger, Version, Created and Inputs.
- The Timeline on the left shows one bar for each task attempt,
greet #1andreport #1. The inspector on the right shows the logs, outputs, metrics and artifacts.
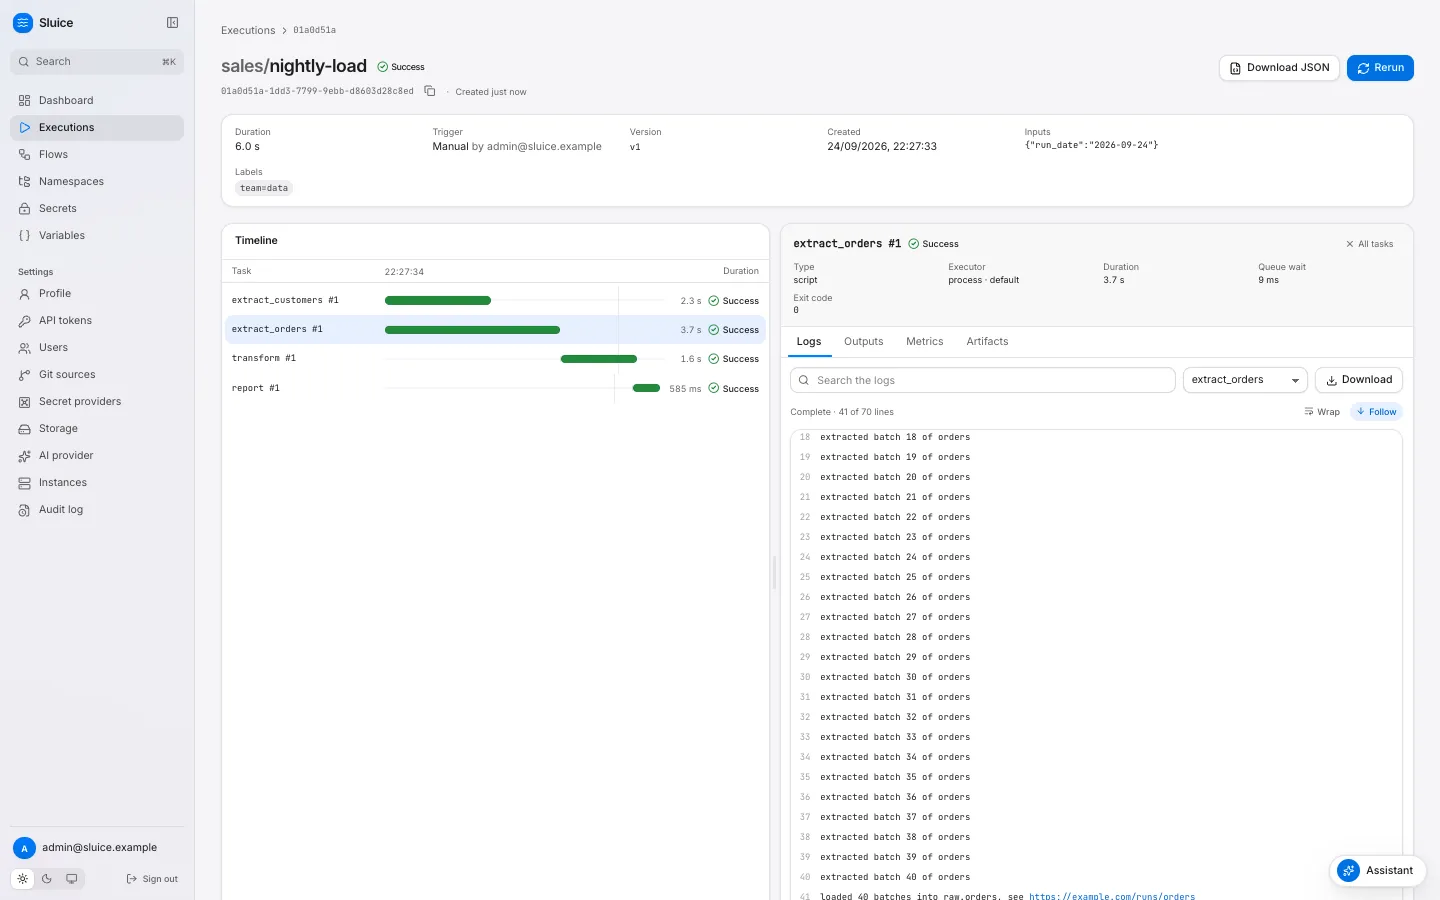
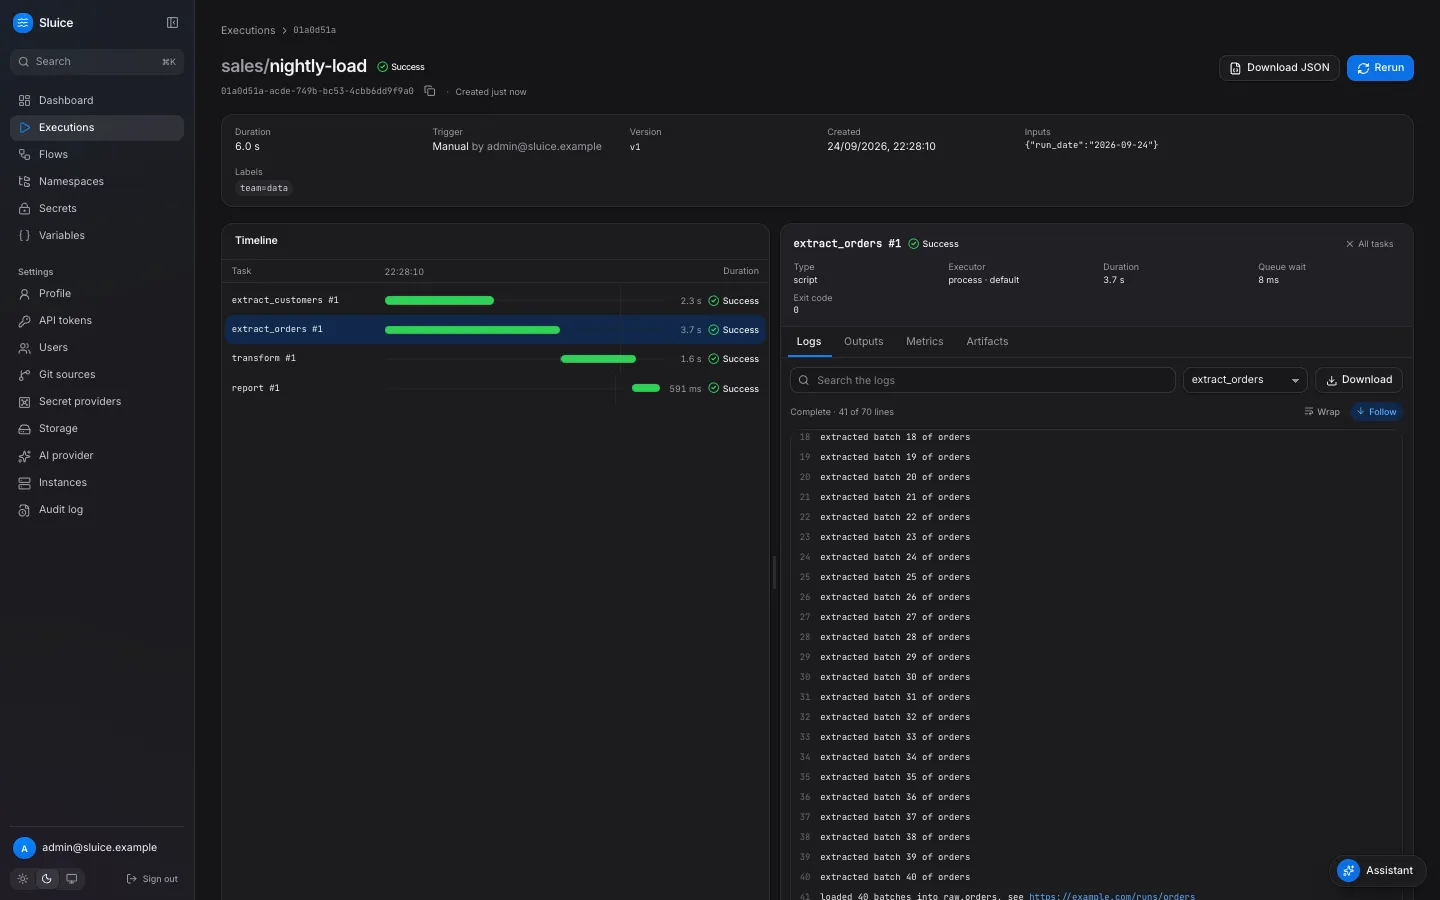
Look at the result of your run:
- Read the Logs tab. It shows
hello worldfromgreetandgreet counted 3fromreport. - Click the bar
greet #1in the Timeline. A card shows the task type, the executor, the duration, the queue wait and the exit code. The tabs now show only the data ofgreet. - Click Outputs. The task
greethas the outputcountwith the value3. - Click Metrics. The metric
greetingshas the value3and the unitrows. - Click All tasks on the card to show the data of all tasks again.
The log viewer has a search field, a Task filter and a Download button. Follow keeps the newest line in view while the execution runs. Wrap wraps long lines. Drag the line between the timeline and the inspector to change their widths.
Go back to the flow page. The Overview tab now shows the last execution, a chart of the durations and a chart of the metric greetings.
Run the flow from a terminal
Section titled “Run the flow from a terminal”The sluice binary is also a client of the server. It needs the URL of the server and an API token.
- Click API tokens under Settings in the sidebar.
- Click Create token.
- Type
cliin Name and select Operator in Role. - Click Create token. The dialog shows the token once.
- Click Copy, then click Done.
Get the sluice binary. The client commands are in the releases after v0.1.2.
Run the installer. It downloads the newest release for your system, checks it against the published checksum, and puts sluice in /usr/local/bin:
curl -fsSL https://raw.githubusercontent.com/alternayte/sluice/main/install.sh | shBuild the binary in the repository with Go:
go build -o sluice ./cmd/sluicesudo mv sluice /usr/local/bin/Set the URL and the token, then run the flow with another input:
export SLUICE_URL=http://localhost:8080export SLUICE_TOKEN=slu_paste-your-token-heresluice run demo/hello --wait --input name=cli--wait streams the log lines to stderr until the execution ends. Then the command prints the end state and the URL of the execution:
waiting for http://localhost:8080/executions/01a0d50c-3d6c-7e9a-b851-f963f7aaf81b[greet#1] hello cli[report#1] greet counted 3SUCCESS demo/hello 01a0d50c-3d6c-7e9a-b851-f963f7aaf81b in 303mshttp://localhost:8080/executions/01a0d50c-3d6c-7e9a-b851-f963f7aaf81bThe exit code is the end state: 0 for SUCCESS and 10 for FAILED. Exit codes lists all codes. List the executions of the flow to see both runs:
sluice executions list --flow demo/helloRemove the stack
Section titled “Remove the stack”This command removes the containers and the database volume. It deletes all flows, executions and secrets.
docker compose -f deploy/compose/compose.yml down -v