
Metrics
Copy page
This page lists every Prometheus metric that /metrics serves, and defines the figures of the dashboard.
Endpoint
Section titled “Endpoint”Each instance serves the Prometheus text format at GET /metrics. The endpoint needs no credential. Scrape each instance, not the load balancer: the HTTP histogram counts only the requests of the instance that served them.
curl -s http://localhost:8080/metrics | grep '^sluice_'/metrics is on the same port as the UI and the API. To keep it private, block /metrics at the Ingress or the reverse proxy, and scrape the pods directly.
Sluice metrics
Section titled “Sluice metrics”| Name | Type | Labels | Value |
|---|---|---|---|
sluice_executions |
gauge | state |
Count of rows in executions for each state. |
sluice_task_runs |
gauge | state |
Count of rows in task_runs for each state. Each retry attempt is one row. |
sluice_queue_depth |
gauge | pool |
Count of task runs in the state QUEUED for each pool. |
sluice_http_request_duration_seconds |
histogram | method, route, status |
Duration of each HTTP request that this instance served. |
Database gauges
Section titled “Database gauges”The server computes the three gauges with a GROUP BY query on the database at each scrape. Every instance thus reports the same values for the whole deployment. Do not add them across instances. Use max, or read one instance.
| Gauge | Series |
|---|---|
sluice_executions |
Always all eight states: QUEUED, RUNNING, CANCELLING, SUCCESS, FAILED, TIMED_OUT, CANCELLED, SKIPPED. A state without rows has the value 0. |
sluice_task_runs |
Always all eight states: PENDING, QUEUED, RUNNING, SUCCESS, FAILED, TIMED_OUT, CANCELLED, SKIPPED. |
sluice_queue_depth |
One series for each pool with queued task runs. When no task run waits, the only series is pool="default" with the value 0. |
The gauges count every row that retention has not deleted yet. The counts of the end states thus grow until SLUICE_RETENTION_DAYS removes old executions. For rates, use the change of the gauge over time, or the dashboard.
Each query has a timeout of 5 seconds. When a query fails, the scrape has no series for that gauge, and the server logs metrics query failed at the level warn.
HTTP histogram
Section titled “HTTP histogram”| Label | Values |
|---|---|
method |
The HTTP method. |
route |
The route pattern, for example /api/v1/executions/{executionId}. The web UI is /*. An unknown API path is /api/*. A request that matched no route is unmatched. |
status |
The status code of the response. A handler that wrote no status counts as 200. |
The buckets are the Prometheus defaults, from 0.005 to 10 seconds. The runner routes under /api/runner/v1 are in the histogram too.
An event stream stays open until its execution ends. Its observation thus shows the length of the stream, not a response time. Leave the /events and /logs/stream routes out of latency queries.
Process and runtime metrics
Section titled “Process and runtime metrics”The registry also has the standard collectors of the Prometheus Go client:
| Prefix | Content |
|---|---|
go_* |
The Go runtime: goroutines, threads, garbage collection and memory. |
process_* |
The process: CPU time, resident and virtual memory, open file descriptors and the start time. |
Example queries
Section titled “Example queries”| Question | PromQL |
|---|---|
| Queued task runs for each pool | max by (pool) (sluice_queue_depth) |
| Executions that run now | max(sluice_executions{state=~"RUNNING|CANCELLING"}) |
| Failed executions in the last hour | max(delta(sluice_executions{state="FAILED"}[1h])) |
| API p95 latency for each route | histogram_quantile(0.95, sum by (le, route) (rate(sluice_http_request_duration_seconds_bucket{route=~"/api/v1/.*", route!~".*/(events|logs/stream)"}[5m]))) |
| Rate of 5xx responses | sum(rate(sluice_http_request_duration_seconds_count{status=~"5.."}[5m])) |
The delta query gives a wrong result when retention deletes executions in the same window.
Suggested alerts
Section titled “Suggested alerts”| Alert | Condition | First step |
|---|---|---|
| Queue grows | max by (pool) (sluice_queue_depth) > 0 for 15 minutes |
Look for no_instance_for_pool on the queued task runs. See Runbook. |
| Server errors | sum(rate(sluice_http_request_duration_seconds_count{status=~"5.."}[5m])) > 0 |
Find the request ID of the failed request in the server log. |
| Not ready | /readyz returns 503 |
Read the failed list of the response. See Runbook. |
| Gauges missing | absent(sluice_executions) |
A gauge query failed. Look for metrics query failed in the server log. |
Dashboard figures
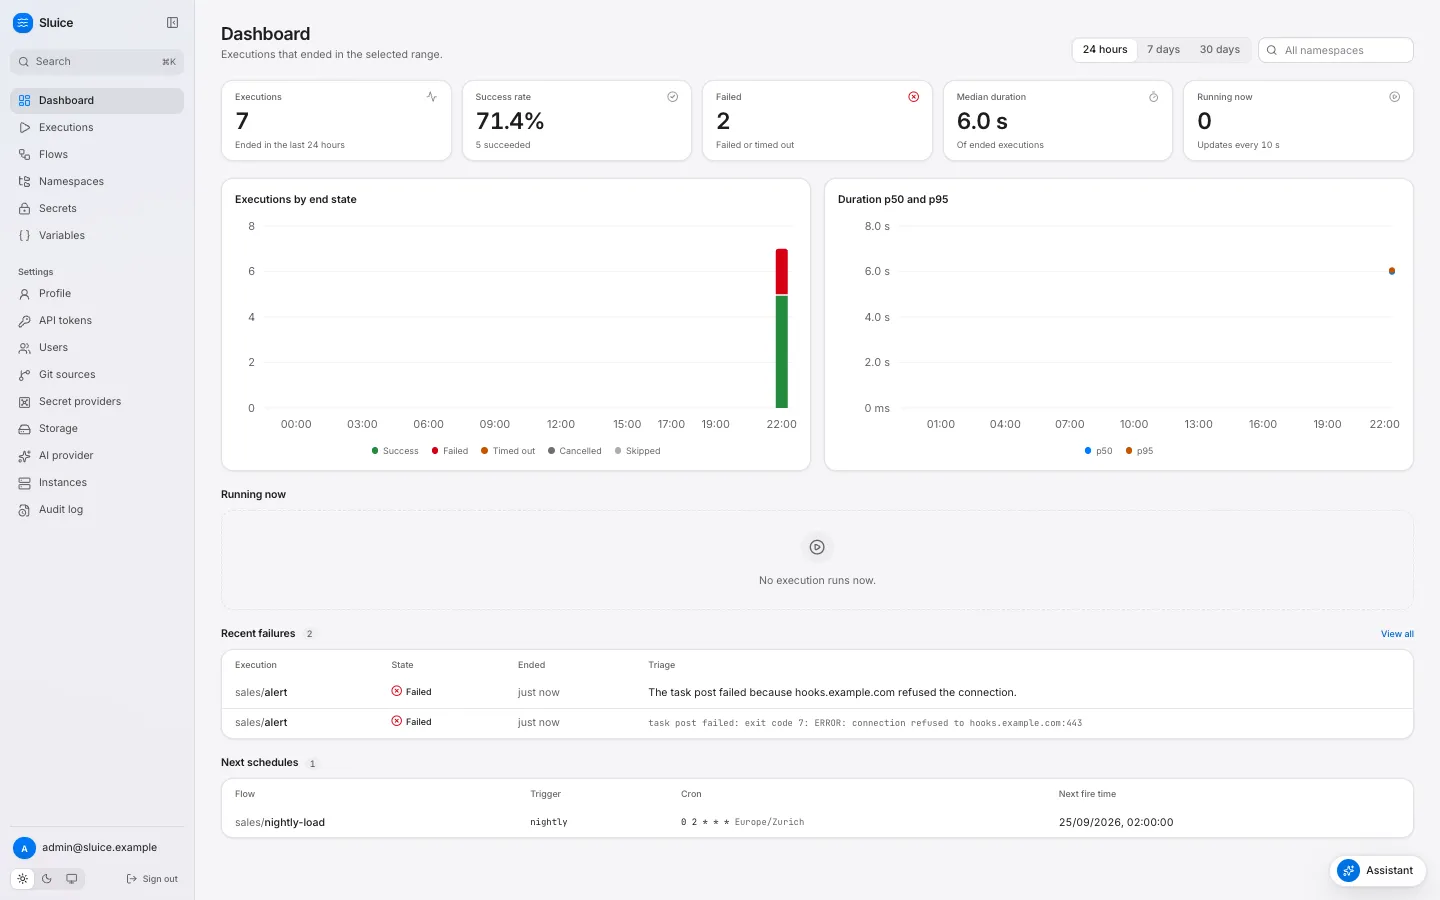
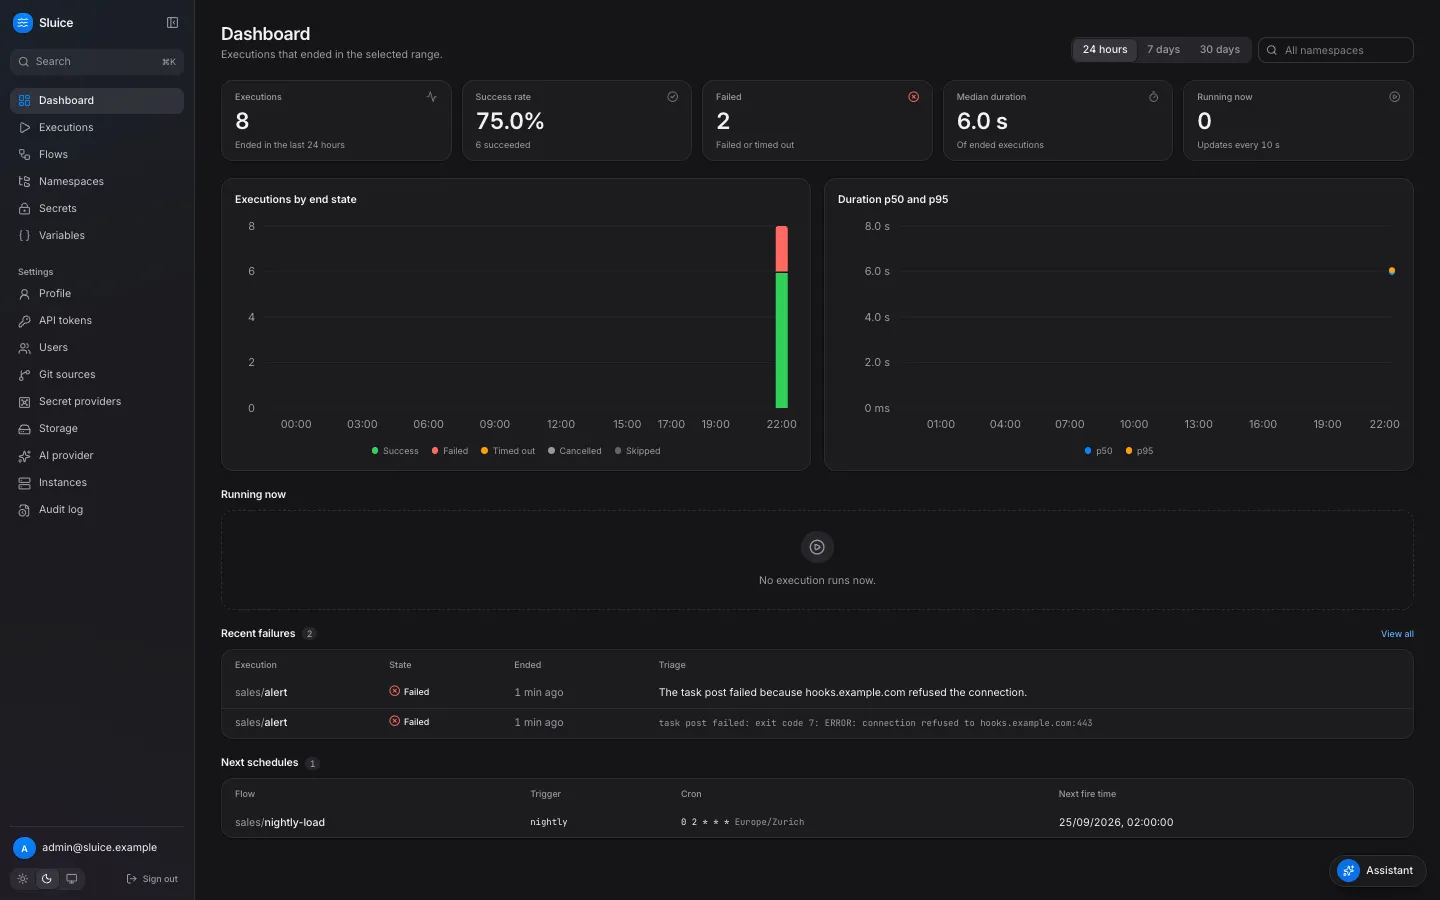
Section titled “Dashboard figures”The dashboard reads GET /api/v1/stats/dashboard. The data comes from Postgres, not from Prometheus.
Ranges
Section titled “Ranges”range |
Span | Bucket |
|---|---|---|
24h |
24 hours | 1 hour |
7d |
7 days | 1 day |
30d |
30 days | 1 day |
The window ends at the end of the current bucket in UTC, and starts one span before. The optional namespace parameter selects a namespace and all its children. Another range value gets 422 validation_failed with the field range.
Figures
Section titled “Figures”| Figure | API field | Definition |
|---|---|---|
| Executions | kpis.executions |
Executions that ended in the window, in the states SUCCESS, FAILED, TIMED_OUT, CANCELLED and SKIPPED. |
| Success rate | kpis.success_rate |
SUCCESS / (SUCCESS + FAILED + TIMED_OUT) over the executions that ended in the window. |
| Failed | kpis.failed |
Executions that ended FAILED in the window. kpis.timed_out counts TIMED_OUT. |
| Median duration | kpis.median_duration_ms |
The median of duration_ms over the executions that ended SUCCESS, FAILED or TIMED_OUT in the window. |
| Running now | kpis.running |
Executions in the state RUNNING or CANCELLING now. The range does not apply. |
The success rate leaves out CANCELLED and SKIPPED executions. A user or a concurrency limit causes these states, so they say nothing about the run. When the window has no execution that ended SUCCESS, FAILED or TIMED_OUT, the rate is null, and the UI shows “—”. The response also has kpis.succeeded, kpis.cancelled and kpis.skipped.
Charts and tables
Section titled “Charts and tables”| Element | API field | Definition |
|---|---|---|
| Executions by end state | buckets[].success, failed, timed_out, cancelled, skipped |
The count of ended executions for each bucket and end state. ended_at sets the bucket of an execution. |
| Duration p50 and p95 | buckets[].p50_ms, buckets[].p95_ms |
The 50th and 95th percentile of duration_ms in each bucket, over SUCCESS, FAILED and TIMED_OUT. A bucket without such executions has no value. |
| Running now | running |
Up to 20 executions in RUNNING or CANCELLING, oldest start first. |
| Recent failures | recent_failures |
The last 10 executions that ended FAILED or TIMED_OUT, with the summary of the latest AI triage. The range does not apply. |
| Next schedules | GET /api/v1/schedules/upcoming |
The next fire times of the active schedules. |
$ curl -s -H "Authorization: Bearer $SLUICE_TOKEN" "$SLUICE_URL/api/v1/stats/dashboard?range=24h"{"range":"24h","from":"…","to":"…","bucket_seconds":3600, "kpis":{"executions":15,"succeeded":13,"failed":2,"timed_out":0,"cancelled":0,"skipped":0, "running":0,"success_rate":0.8666666666666667,"median_duration_ms":1877}, "buckets":[…],"running":[],"recent_failures":[…]}Flow charts
Section titled “Flow charts”The flow page shows two more charts:
| Chart | API | Definition |
|---|---|---|
| State strip and duration | GET /api/v1/flows/{namespace}/{flowId}/stats |
The last 50 executions of the flow, newest first, with state and duration. |
| Custom metric | GET /api/v1/flows/{namespace}/{flowId}/metrics |
One series for each value of the group_by tag. agg is sum, avg or max of the metric values of each execution, over the last 50 executions. |
Tasks emit custom metrics through the outputs file. See Pass data between tasks.